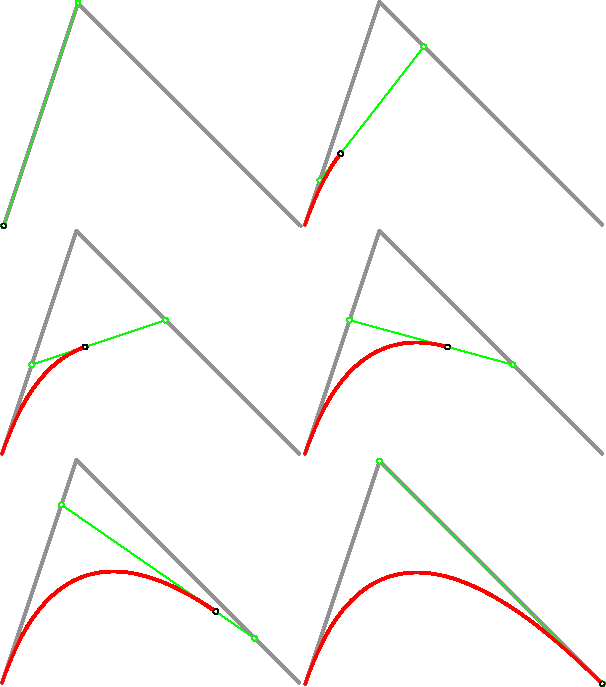
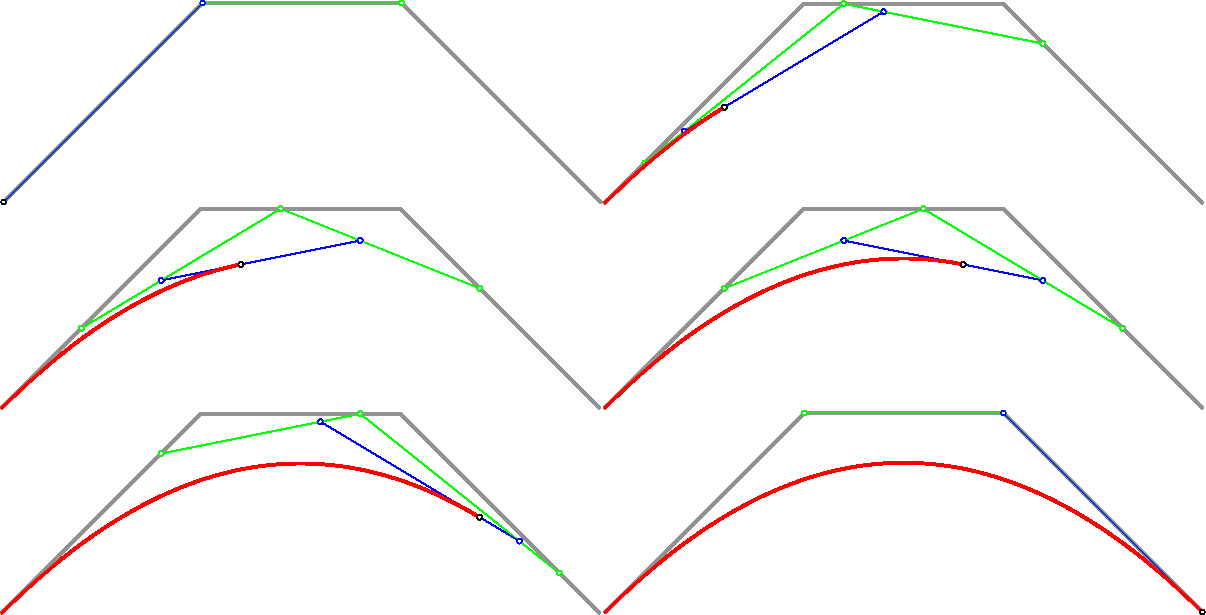
对贝赛尔曲线的认识只从静态图上看不是太好理解,看动画轨迹生成过程就很容易看出来了。 刚好最近学习了用 Asymptote 绘图,它也可以绘制动态图片,于是我绘制了贝赛尔(Bezier)曲线的演示图。
如下动画图
直线图

Asymptote 绘制代码:
import animate;

animation Ani;
pair Z0 = (0, 0), Z1 = (4, 0);
real t;

int n = 30;
for(int i = 0; i <= n; ++i) {
    picture pic;
    size(pic, 300);
    t = i / n;
    pair Z = interp(Z0, Z1, t);
    draw(pic, Z0--Z1, gray(0.5)+linewidth(3));
    draw(pic, Z0--Z, red+linewidth(3));
    dot(pic, Z, black+linewidth(1), UnFill);
    Ani.add(pic);
}
Ani.movie(delay=300);
二次曲线图

Asymptote 绘制代码:
import animate;
import graph;

animation Ani;
pair Z0 = (0, 0), Z1 = (4, 0), C = (1, 3);

pair f(real t) {
    return (1 - t)^2 * Z0 + 2t * (1 - t) * C + t^2 * Z1;
}

int n = 30;
for(int i = 0; i <= n; ++i) {
    picture pic;
    size(pic, 300);
    real t = i / n;
    pair A = interp(Z0, C, t);
    pair B = interp(C, Z1, t);
    pair Z = interp(A, B, t);
    draw(pic, Z0--C--Z1, gray(0.5)+linewidth(3));
    draw(pic, A--B, green+linewidth(1));
    dot(pic, A, green+linewidth(1), UnFill);
    dot(pic, B, green+linewidth(1), UnFill);
    draw(pic, graph(f,0,t), red+linewidth(3));
    dot(pic, Z, black+linewidth(1), UnFill);
    Ani.add(pic);
}
Ani.movie(delay=300);
三次曲线图

Asymptote 绘制代码:
import animate;
import graph;

animation Ani;
pair Z0 = (0, 0), C0 = (1, 1), C1 = (2, 1), Z1 = (3, 0);

pair f(real t) {
    return (1 - t)^3 * Z0 + 3t * (1 - t)^2 * C0 + 3t^2 * (1-t) * C1 + t^3 * Z1;
}

int n = 30;
for(int i = 0; i <= n; ++i) {
    picture pic;
    real t = i / n;
    size(pic, 600);
    draw(pic, Z0--C0--C1--Z1, gray(0.5)+linewidth(3));
    pair M0 = interp(Z0, C0, t);
    pair M1 = interp(C0, C1, t);
    pair M2 = interp(C1, Z1, t);
    pair M3 = interp(M0, M1, t);
    pair M4 = interp(M1, M2, t);
    pair Z = interp(M3, M4, t);
    draw(pic, M0--M1--M2, green+linewidth(1));
    dot(pic, M0, green+linewidth(1), UnFill);
    dot(pic, M1, green+linewidth(1), UnFill);
    dot(pic, M2, green+linewidth(1), UnFill);
    draw(pic, M3--M4, blue+linewidth(1));
    dot(pic, M3, blue+linewidth(1), UnFill);
    dot(pic, M4, blue+linewidth(1), UnFill);
    draw(pic, graph(f, 0, t), red+linewidth(3));
    dot(pic, Z, black+linewidth(1), UnFill);
    Ani.add(pic);
}
Ani.movie(delay=300);